

Introducing Step Metrics for Bitbucket Pipelines
Bitbucket Pipelines’ new Step Metrics feature gives teams deep visibility into CPU and memory usage for each pipeline step.

For teams using Bitbucket Pipelines, it hasn’t always been easy to see why a build step was slow or what was happening behind the scenes. If a pipeline stage suddenly takes longer or fails, where do you look first? Resource usage has often been a mystery. Now, Bitbucket Cloud’s new Step Metrics feature finally provides that missing visibility into your CI/CD workflow. This in-depth look at Step Metrics will explain what it is, how to use it, and how it can help your team optimize pipeline performance. At Atlas Bench, we’re excited about this addition because it gives development teams a data-driven window into their build process. In this blog, we’ll break down the key capabilities of Step Metrics and share tips to get the most out of it for faster and more reliable builds.
What Are Step Metrics in Bitbucket Pipelines?
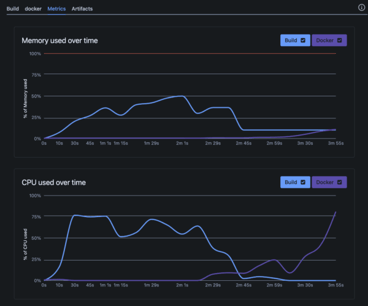
Step Metrics is a new capability in Bitbucket Pipelines that lets you monitor the CPU and memory usage of each step in your pipeline. Every pipeline step runs in a build container and can have additional service containers. Step Metrics gathers real-time data from all these containers and presents it in an easy-to-read graph once the step completes. It’s like having a live dashboard for the resources each step consumes, allowing you to peek under the hood of your continuous integration process.
This feature addresses a common challenge in CI/CD: lack of insight. Without metrics, you might only notice a problem when a step times out or your build fails. Now you can actually see how much CPU and memory were used at each point in time during the step. For example, if your test suite is running slower than before, Step Metrics might reveal that the CPU was maxed out during certain test cases or that memory usage spiked when loading test data. By visualizing these details, teams can understand the story behind a pipeline’s performance. In short, Step Metrics turns vague performance issues into concrete data that you can act on.
Importantly, the data is presented for each container involved. If your pipeline step uses a service, you’ll be able to track that service’s resource usage separately from the main build container. Perhaps the database container’s memory usage shot up during a migration script that insight would be hard to get otherwise. With Step Metrics, it’s immediately clear which component of your pipeline is using the most resources. This level of granularity means you can pinpoint specific bottlenecks or inefficiencies with much greater accuracy than before.
Why Step Metrics Matter: Key Benefits
-
Spot bottlenecks early: Use metrics to catch any step or service that’s consuming abnormal CPU or memory before it slows down your pipeline. If one command in your build consistently maxes out the CPU, you’ll see the spike on the graph and know exactly where to investigate. Identifying these bottlenecks early means you can fix issues before they impact your team’s productivity or break the build.
-
Optimize resource allocation: With concrete data on resource usage, you can make informed decisions to speed up your pipelines. For instance, if a certain build step is always running at 90% memory usage, you might increase the step’s size or refactor the task into smaller jobs. Conversely, if a step is using very little CPU, you might be able to run it on a smaller size container and save build minutes or cost. Step Metrics help ensure each pipeline step has the right amount of resources for the job no more guessing.
-
Troubleshoot with confidence: When a pipeline fails or runs slowly, you no longer have to play detective with only log files. Step Metrics provides hard data to back up your troubleshooting. For example, if a build is failing due to out-of-memory errors, the memory graph will clearly show the moment it hit the limit. If a deployment script is hanging, the CPU usage might flatline, indicating the script is waiting on something external. Having these clues allows you to diagnose and resolve issues faster, because you’re solving problems with facts rather than hunches.
How to Access and Use Step Metrics
-
Navigate to the Metrics tab for a pipeline step: In the Bitbucket Pipelines interface, each step of your pipeline run now includes a Metrics tab alongside the logs and artifacts tabs. After a pipeline finishes running, click on any step and then select the Metrics tab. This will open up the dashboard for all things resource usage related to that step. The interface displays one graph for CPU usage and another for memory usage, plotted over the runtime of the step.
-
Customize your view by filtering services Below each graph, you’ll find checkboxes or toggles for the different containers involved in the step: typically one for the main build container and additional ones for each service container. You can toggle these on or off to show or hide the metrics for individual services. This is helpful when you have a busy chart and want to focus on a specific container. For example, you might uncheck everything except your database service to see only its memory usage pattern. Filtering makes it easy to zero in on what matters most to you at any given time.
-
Drill down into the data points: The Metrics dashboard is interactive. You can hover your mouse over any point on the CPU or memory graph to see the exact value at that timestamp. A small tooltip will display details like the time and the resource usage measured at that moment. This granular data lets you pinpoint exactly when and where a spike or drop occurred. By correlating the timestamp with your pipeline logs, you can even identify which command was running when the resource usage peaked. For instance, you might observe that at 2 minutes 30 seconds into the step, the CPU spiked to 100% checking your logs, you find that’s precisely when your test suite started running a particularly heavy test. This level of detail takes the guesswork out of understanding performance issues during pipeline runs.
Using Step Metrics is straightforward, but it’s worth noting that the data only appears after the step finishes. Once the step is done, you have a complete timeline of its resource consumption. Make it a habit to review this whenever you notice a pipeline slow-down or failure the insights are right there in the same interface where you already manage your builds.

Important Considerations and Limitations
While Step Metrics is a powerful tool, there are a few important details and limitations to keep in mind:
-
14-day data retention: Bitbucket stores the metrics data for each pipeline step for 14 days after that step completes. After two weeks, the metrics for that run are automatically deleted. This means if you want to perform any longer-term analysis or keep records of your pipeline performance over months, you’ll need to export the data within that 14-day window. In practice, two weeks is usually enough to troubleshoot recent builds or observe short-term trends, but it’s good to be aware of this time limit. Teams that want to track metrics over a longer period might consider saving the metrics graphs or values elsewhere as needed.
-
Metrics available post-run: You can only view step metrics after the step has finished running. During the actual execution of the pipeline, there is no live updating metric dashboard. In other words, you won’t see the CPU or memory dial moving in real time as your build runs. The metrics become available once the step completes and Bitbucket has processed the data. This is an important distinction Step Metrics is meant for analysis and insight after the fact, not for real-time monitoring or altering a running build. If you’re watching a pipeline in progress, you’ll still rely on the live logs; then once it’s done, you can switch to the Metrics tab to review what happened under the hood.
-
5-second sampling interval: The resource usage data points are collected at a fixed interval of every 5 seconds. This frequency provides a detailed view of how CPU and memory usage change throughout the step without overwhelming you with too much data. A new data point every five seconds is generally sufficient to capture significant trends and spikes, since most operations in a CI pipeline last longer than a few seconds. However, be mindful that extremely short-lived spikes might not appear if they happen between the sampling intervals. In practice, a 5-second resolution is a good balance, and it should reveal any sustained resource usage patterns or periodic fluctuations in your pipeline steps.
By understanding these limitations, you can use Step Metrics more effectively and not be caught off guard. For instance, if you check a pipeline run from a month ago, you won’t find the metrics knowing about the 14-day retention would set the expectation. Similarly, if you need live monitoring during a run, you’ll recall that Step Metrics isn’t intended for that purpose and perhaps use other monitoring tools for real-time feedback. Despite these constraints, Step Metrics offers invaluable information that was not easily accessible to Bitbucket Pipelines users until now.
Pro Tips for Getting the Most Out of Step Metrics
-
Make metrics review a regular habit: Incorporate a quick metrics check into your team’s workflow whenever a pipeline runs noticeably slow or encounters an issue. By regularly reviewing CPU and memory graphs for your most important pipelines, you can catch trends early. For example, you might notice that over the past week, a particular build step has been gradually using more and more memory. Catching that trend early could allow you to investigate a memory leak or inefficient process in your code before it becomes a serious problem.
-
Compare across different builds: Don’t look at your pipeline runs in isolation. Bitbucket Pipelines will run the same steps for every commit or every build on your main branch use that to your advantage. After making changes to your code or configuration, compare the step metrics from before and after the change. If yesterday’s build used 50% CPU on the test step and today it’s using 80%, that jump might indicate a regression introduced by the latest code. Likewise, if you’ve optimized something in your code, the metrics should reflect an improvement. Over time, these comparisons help you identify which changes had positive or negative effects on pipeline performance, so you can continuously improve your CI/CD efficiency.
-
Share findings with the team: Step Metrics can be a great collaboration and learning tool. When you uncover an interesting insight say, a particular test is consuming a huge amount of memory share that information with your team. This could be done in team meetings, via chat, or by capturing a screenshot of the metrics graph and posting it in your project documentation. By making pipeline performance a visible topic, you encourage a culture of continuous improvement. Team members might suggest different approaches once they see the data. Over time, this collaborative analysis can significantly speed up your build times and make your pipelines more robust. Everyone on the team benefits when the pipeline runs faster and with fewer hiccups.
-
Use data to inform pipeline configuration: If your step metrics consistently show high usage, consider adjusting your pipeline configuration accordingly. Bitbucket Pipelines allows you to specify different pipeline sizes or tweak service definitions. For instance, suppose your integration test step regularly hits 100% CPU you might run that step with more resources or spin up an additional parallel step to distribute the load. On the other hand, if a step is using only 10% of its allocated CPU, you could potentially run multiple tasks in that step in parallel or reduce the step size to save on usage. The key is to let the metrics data guide these decisions. Over time, this tuning ensures that your CI/CD pipeline is not only fast but also cost-effective and well-balanced.

Wrapping Up
Bitbucket’s Step Metrics is a small feature that can drive big improvements in how you manage your CI/CD pipelines. By shining a light on CPU and memory usage, it transforms pipeline optimization from guesswork into a data-informed practice. Teams can now readily see where their pipeline spends the most time and resources, and take action to make builds faster and more reliable. Whether it’s catching an inefficient test, deciding to upgrade a service, or allocating more memory to a critical step, these decisions are much easier when you have solid numbers to back them up.
At Atlas Bench, we believe that tools like Step Metrics pave the way for a culture of continuous improvement in software teams. When developers have clear feedback on performance, they are more empowered to refine their code and pipeline configurations. The result is not just quicker builds, but a more efficient development cycle overall. If your organization uses Bitbucket Pipelines, we recommend taking full advantage of Step Metrics explore the graphs, share the insights, and tweak your pipeline based on what you learn. Over time, you’ll likely see a compounding effect: a few seconds shaved off here and there can add up to significant time saved across dozens or hundreds of builds.
Read next.
Non-Human Identities in Atlassian Cloud: Service Accounts, Tokens, Apps, and Agents
How to govern non-human identities in Atlassian Cloud: service accounts, API tokens, Forge apps, and Rovo agents, each with an owner, scope, and expiry.
October 1, 2026How to Choose an Atlassian Partner for a Jira Cloud Migration
How to choose an Atlassian Solution Partner for a Jira Cloud migration: what to verify, eight questions to ask, red flags, and a shortlist scorecard.
September 30, 2026The Complete Guide to Agent Readiness in Atlassian Cloud
Agent readiness for Atlassian Cloud: the five checks to run before you switch on Rovo agents, from identities and permissions to the off switch.
September 28, 2026How to Review Rovo Agent Access in Jira and Confluence
A step-by-step access review for Rovo agents in Jira and Confluence: who can create them, who can use them, what they can change, and what gets logged.
The blog, weekly.
One email a week with what we published. No drip sequence, and you can leave in a click.