

- Portfolio
- Atlassian Cloud
- Atlassian Analytics
- Atlassian Data Lake
- Business Intelligence
- Jira Reporting
How to Get Started with Atlassian Analytics
Open Atlassian Analytics from the App Switcher and start with pre-built dashboard templates or low-code chart creation to report across Jira, Jira Service Management, Confluence and more. Only Org Admins can configure the connections that bring your products into the Atlassian Data Lake, and you control which projects or spaces are included.

contents
- Navigating the Atlassian Analytics Interface
- Connecting Data and Creating Dashboards
- Atlassian Data Lake: A Centralized Data Platform
- Connecting Your Products to the Data Lake
- Embedding and Sharing Dynamic Data
- Creating a Custom Chart in Atlassian Analytics
- Enhancing Charts with Filters
- Exploring Schemas and Query Logs in Atlassian Data Lake
- Unlock the Power of Atlassian Analytics
Atlassian Analytics is a powerful tool designed to help teams unlock data-driven insights across Jira, Jira Service Management, Confluence, and more. Whether you’re just getting started or looking to optimize your reporting, this guide will walk you through the key features, setup process, and best practices.
Navigating the Atlassian Analytics Interface
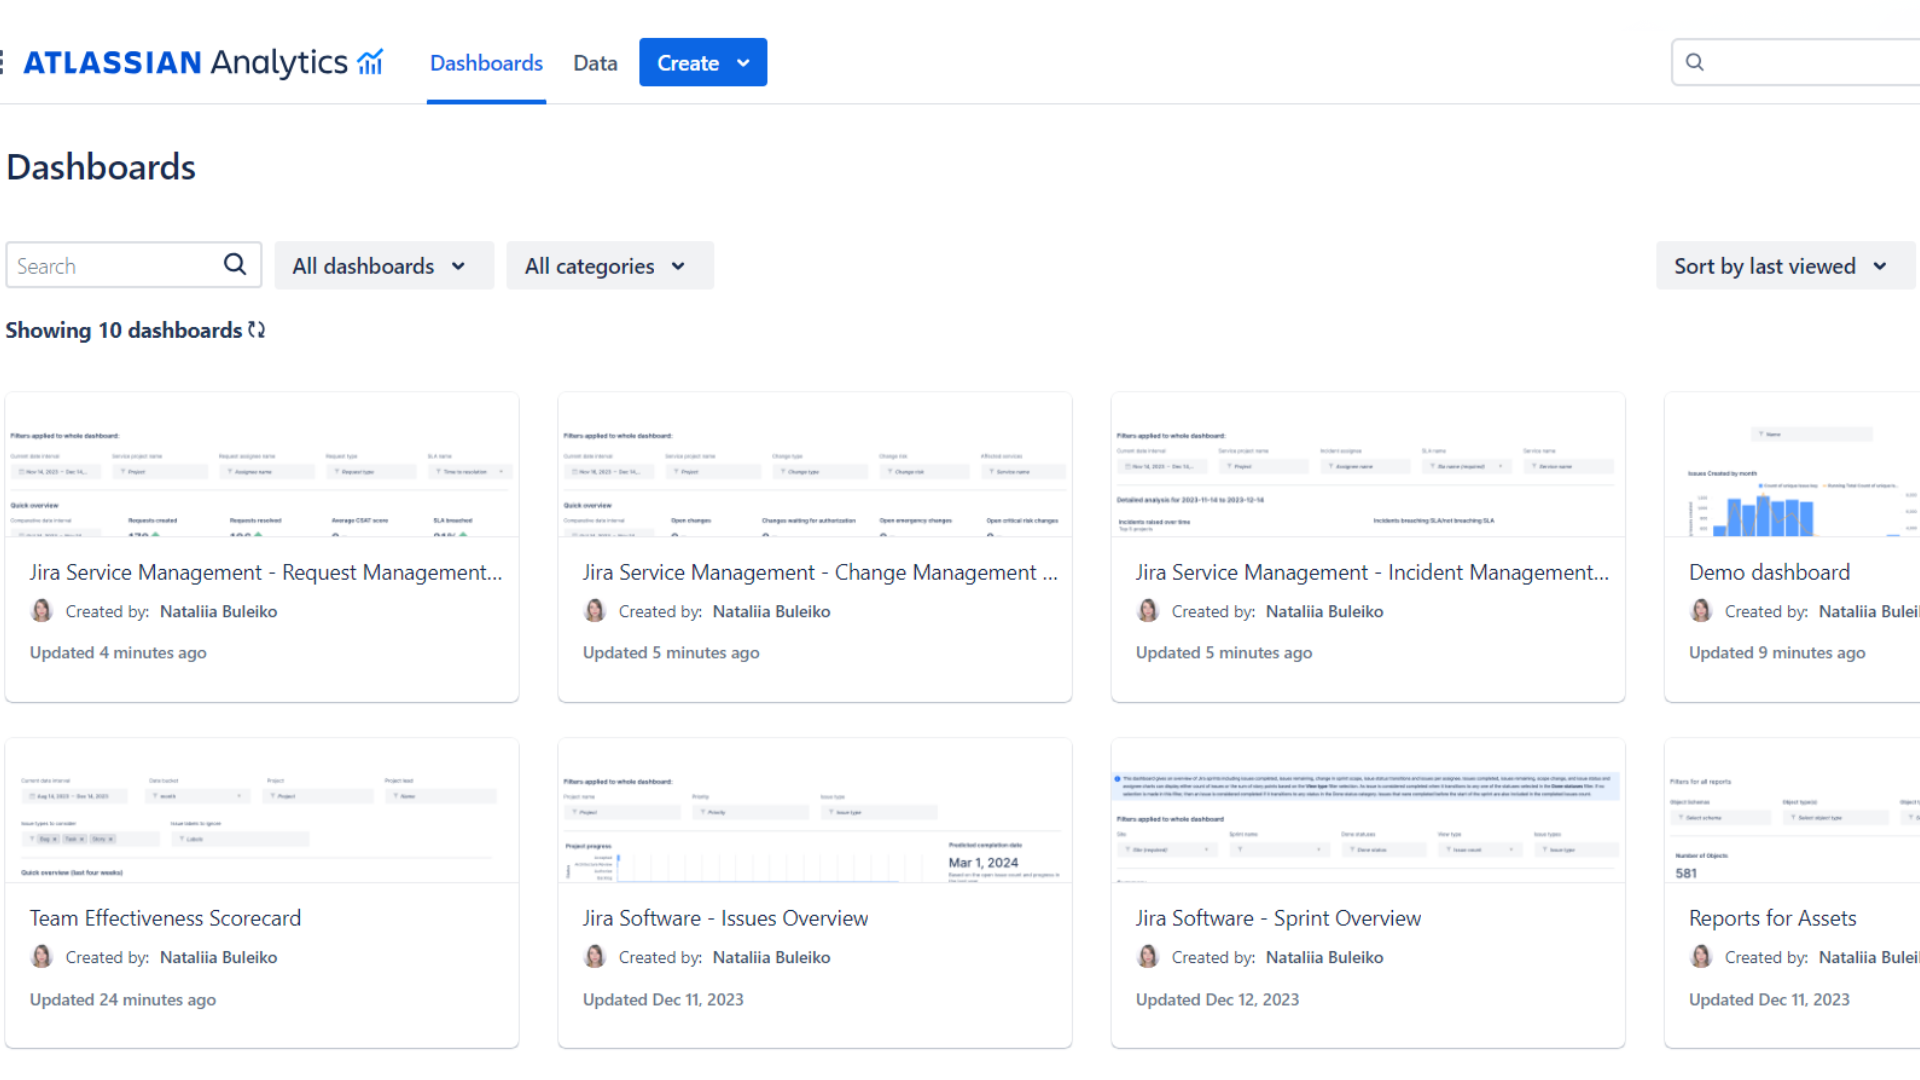
Getting started with Atlassian Analytics is intuitive. Access the platform through the App Switcher, where you can organize dashboards based on user access and customize categories, including sandboxes, for better structure.
Once inside, you can:
-
Filter dashboards in list or card view for quick access.
-
Create new categories to better manage data and insights.
-
View dashboards you’ve created or those shared with you to ensure seamless collaboration.
Connecting Data and Creating Dashboards
Atlassian Analytics simplifies data visualization by providing easy-to-use templates and a low-code/no-code approach.
-
Over 20 pre-built dashboard templates for quick access to key insights.
-
15 customizable chart templates tailored for Jira Software, Jira Service Management, Opsgenie, Assets, and Confluence.
-
Low-code chart creation for teams without technical expertise.
-
Dedicated dashboards per Atlassian product to streamline reporting.
With these tools, teams can create insightful dashboards without requiring advanced data skills.
Atlassian Data Lake: A Centralized Data Platform
Atlassian Data Lake acts as a single source of truth by centralizing data across Atlassian products. It eliminates the need for API calls and third-party connectors, offering real-time data access.
-
Integrates Jira Software, Jira Work Management, Jira Service Management, Confluence, Opsgenie, Assets, and Jira Product Discovery.
-
Enterprise Insights available for Jira Align to enhance reporting capabilities.
-
Direct connectors to Amazon RDS, Google Cloud, Microsoft Azure, and Databricks simplify cross-referencing.
-
Data export functionality allows seamless integration with BI tools.
This ensures that teams can work with up-to-date, accurate data without complex manual extraction processes.
Connecting Your Products to the Data Lake
Integrating your Atlassian products into the Data Lake is a seamless process, giving organizations control over which projects or spaces to include.
-
Only Org Admins can configure connections, ensuring secure data governance.
-
Granular permission settings allow teams to manage data access efficiently.
-
Selective integration ensures only relevant data is included, keeping reports focused.
This approach streamlines data management and ensures compliance with company-wide security policies.
Embedding and Sharing Dynamic Data
Collaboration becomes effortless with Atlassian Analytics' dynamic embedding and sharing capabilities.
-
Embed dashboards and charts using smart links within Confluence.
-
Enable real-time data sharing to replace static reports.
-
Set dashboards to refresh every 30 minutes for accurate insights.
-
Export dashboards as PDFs and data as CSV files for external use.
-
Automate reporting through email subscriptions.
These features help stakeholders stay informed with minimal manual effort.
Creating a Custom Chart in Atlassian Analytics
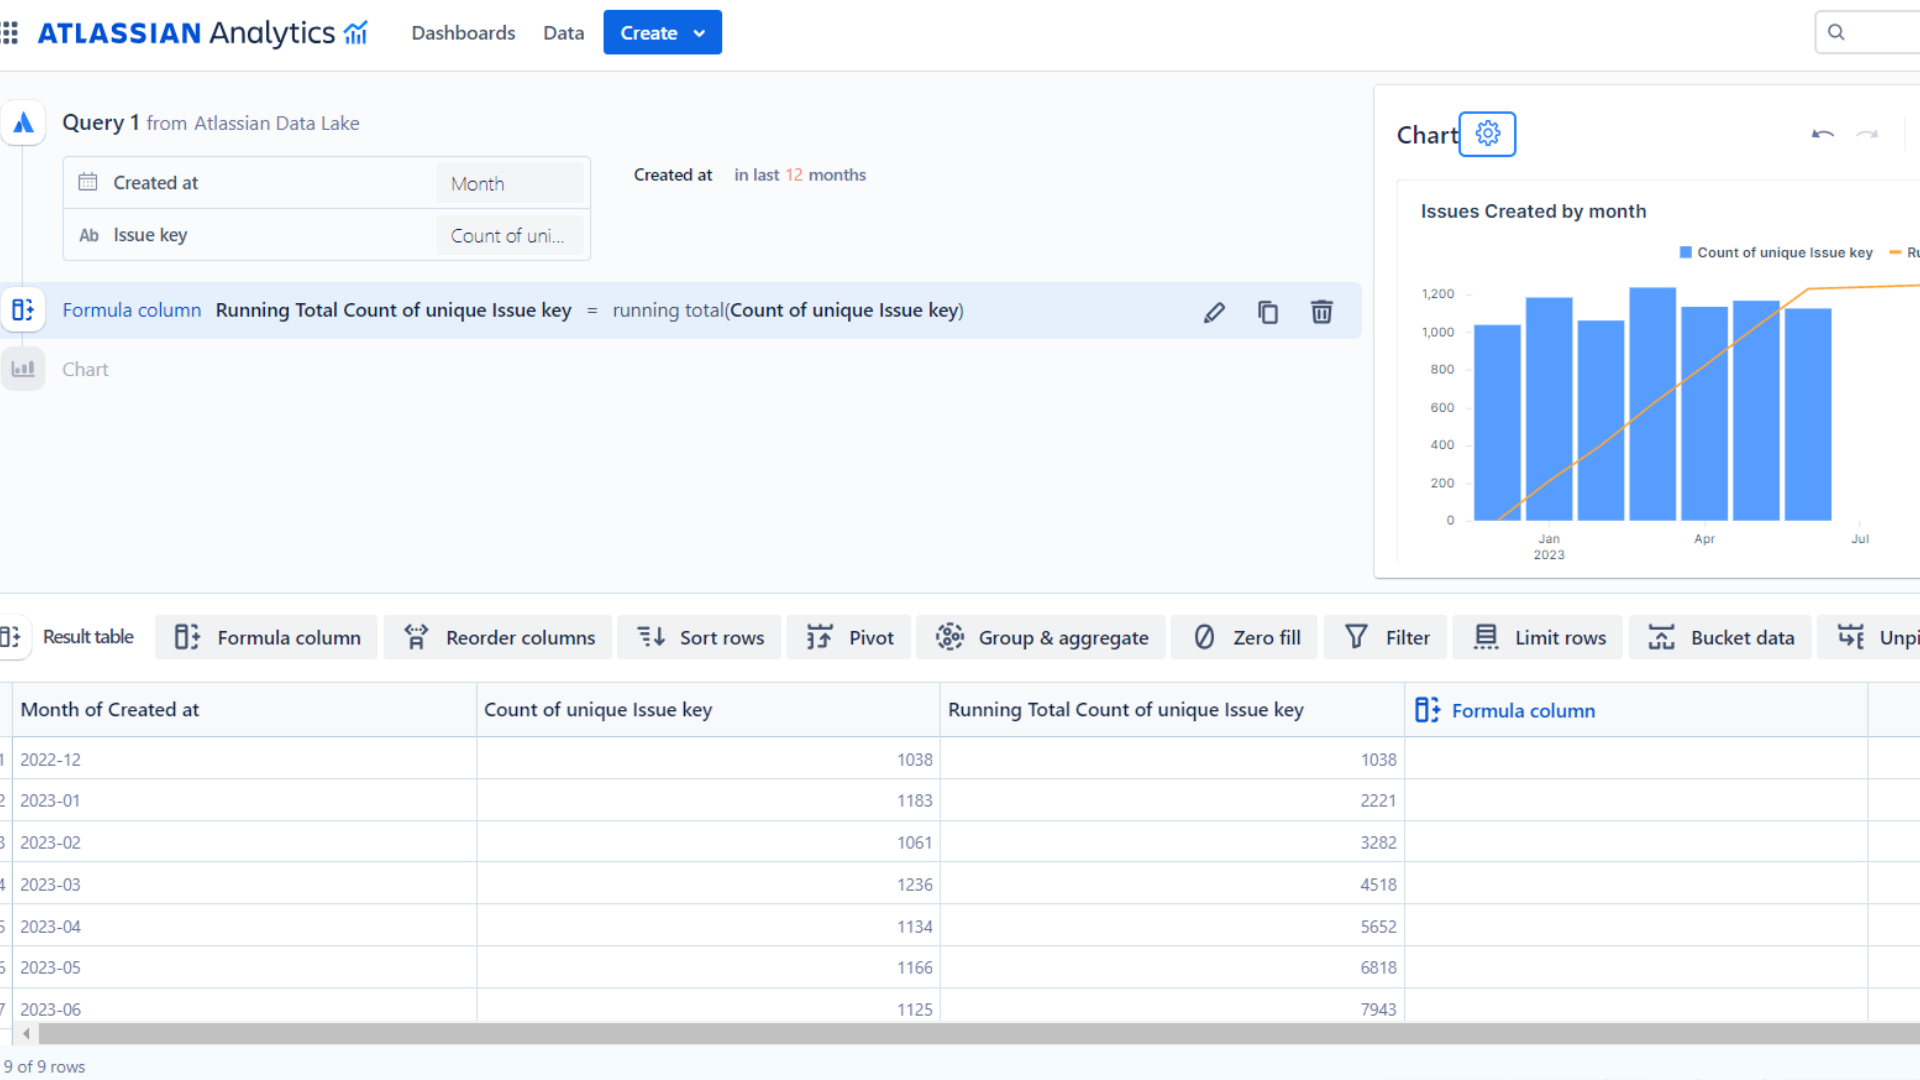
For teams that need advanced customization, Atlassian Analytics allows the creation of custom charts.
-
Select a Custom Chart option.
-
Choose Jira Issue Table as your data source.
-
Apply a date filter for the last 12 months of created issues.
-
Modify SQL queries for further customization.
-
Sort by month and add a formula column for cumulative issue count.
-
Configure the chart settings, including axes and chart types.
-
Save the chart to a new or existing dashboard.
With this flexibility, teams can build tailored reports to track key performance indicators effectively.
Enhancing Charts with Filters
Atlassian Analytics provides interactive filtering to help users drill down into specific datasets.
-
Use a dropdown control to filter by project name.
-
Enable multi-select and allow empty states for more flexibility.
-
Save the filter to ensure dashboards update dynamically.
This level of interactivity helps teams focus on relevant insights in real time.
Exploring Schemas and Query Logs in Atlassian Data Lake
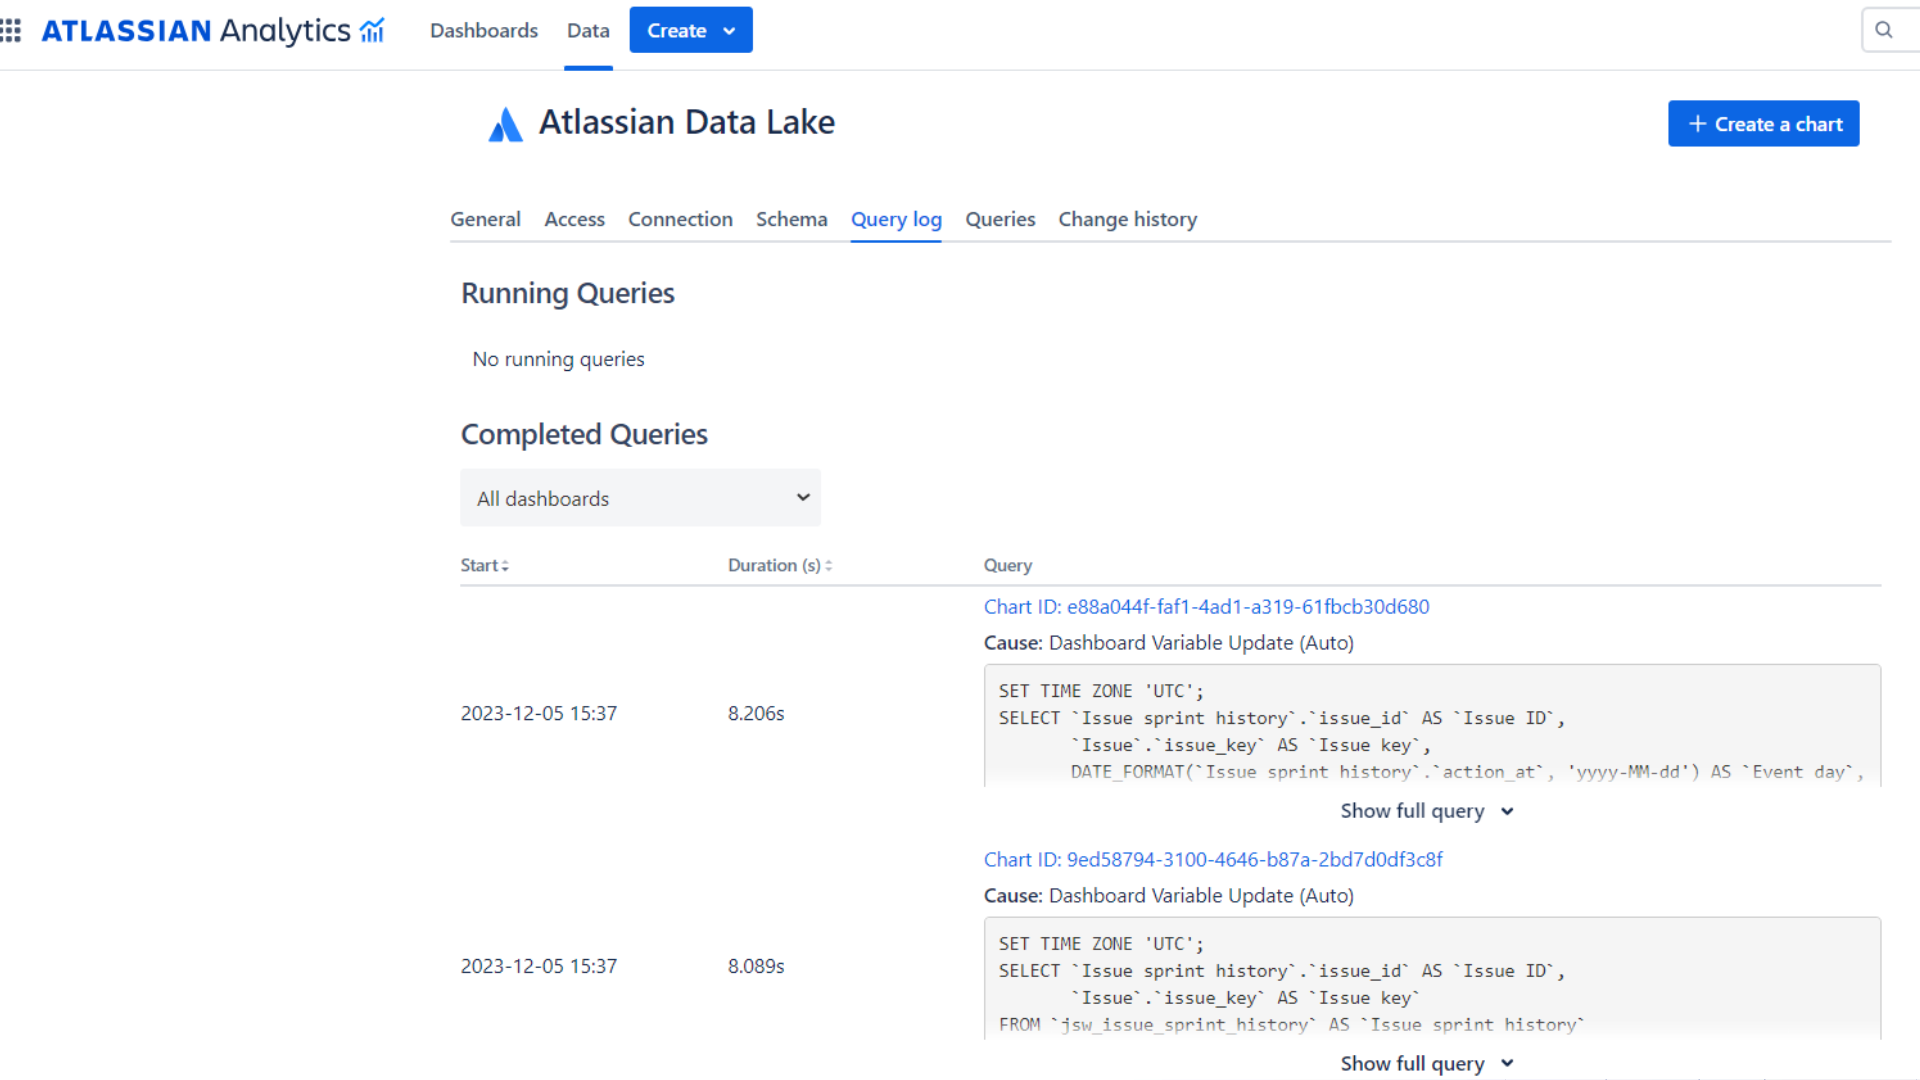
Understanding data structure is key to effective analysis. The Atlassian Data Lake offers visibility into schemas and query logs.
-
View schemas grouped by Atlassian products to understand data connections.
-
Analyze query logs for up to 30 days to track data performance.
-
Optimize query execution by identifying bottlenecks and improving efficiency.
With these tools, teams can ensure smooth performance and accurate data insights.
Unlock the Power of Atlassian Analytics
Atlassian Analytics is designed to simplify reporting, enhance collaboration, and streamline data-driven decision-making. Whether you're leveraging pre-built dashboards, customizing reports, or embedding real-time insights into Confluence, this tool provides everything you need.
Read next.
The Complete Guide to Agent Readiness in Atlassian Cloud
Agent readiness for Atlassian Cloud: the five checks to run before you switch on Rovo agents, from identities and permissions to the off switch.
September 28, 2026How to Review Rovo Agent Access in Jira and Confluence
A step-by-step access review for Rovo agents in Jira and Confluence: who can create them, who can use them, what they can change, and what gets logged.
September 24, 2026What Is Identity Debt in Atlassian Cloud Migration
Learn what identity debt means for Atlassian cloud migration and how to audit unowned accounts, stale permissions, and legacy access risks.
September 21, 2026Rovo Agent Governance in Atlassian Cloud: 2026 Guide
Learn how to govern Rovo agents in Atlassian Cloud with identity controls, Guard policies, workflow guardrails, and audit trails for enterprise AI adoption
The blog, weekly.
One email a week with what we published. No drip sequence, and you can leave in a click.