

- Service Management
- Portfolio
- Atlassian Cloud
- Jira Service Management
- Atlassian Analytics
- ITSM Reporting
- Service Performance Metrics
- JSM Dashboards
Get Better Reporting from Jira Service Management
Discover how to enhance Jira Service Management reporting using Atlassian Analytics.

Getting the most out of Jira Service Management (JSM) goes far beyond ticket tracking; it’s about unlocking valuable insights that help teams improve service delivery, efficiency, and customer satisfaction. Atlassian Analytics, available with Atlassian Cloud Enterprise, enables organizations to bring together data from across the Atlassian ecosystem into one place, making it easier to track trends, evaluate performance, and guide strategic decisions.
Whether you're just starting out or looking to optimize your current setup, this post walks through how to enhance your reporting capabilities in JSM using powerful out-of-the-box dashboard templates, smart sharing strategies, and custom configurations.
Understand the Power of Analytics Dashboards
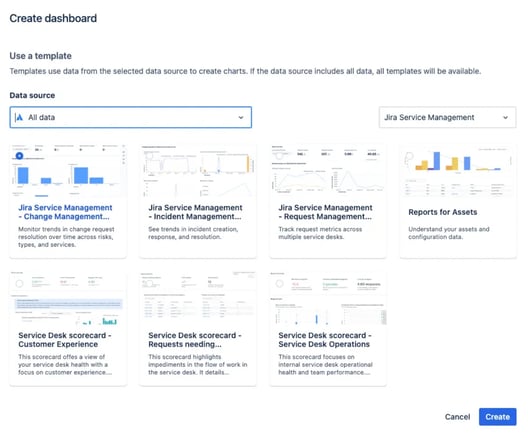
Atlassian provides seven ready-made dashboard templates tailored for Jira Service Management. These dashboards are designed to help service teams assess performance in areas such as request handling, incident response, change management, and asset monitoring. Once implemented, they provide a consolidated view of your service desk’s productivity, workflow health, and customer experience metrics.
You can access these templates directly within Atlassian Analytics and use them as-is or customize them further to fit your needs. By combining these dashboards with data from Jira, Jira Work Management, and even Confluence, you get a full view of your team’s end-to-end delivery process.
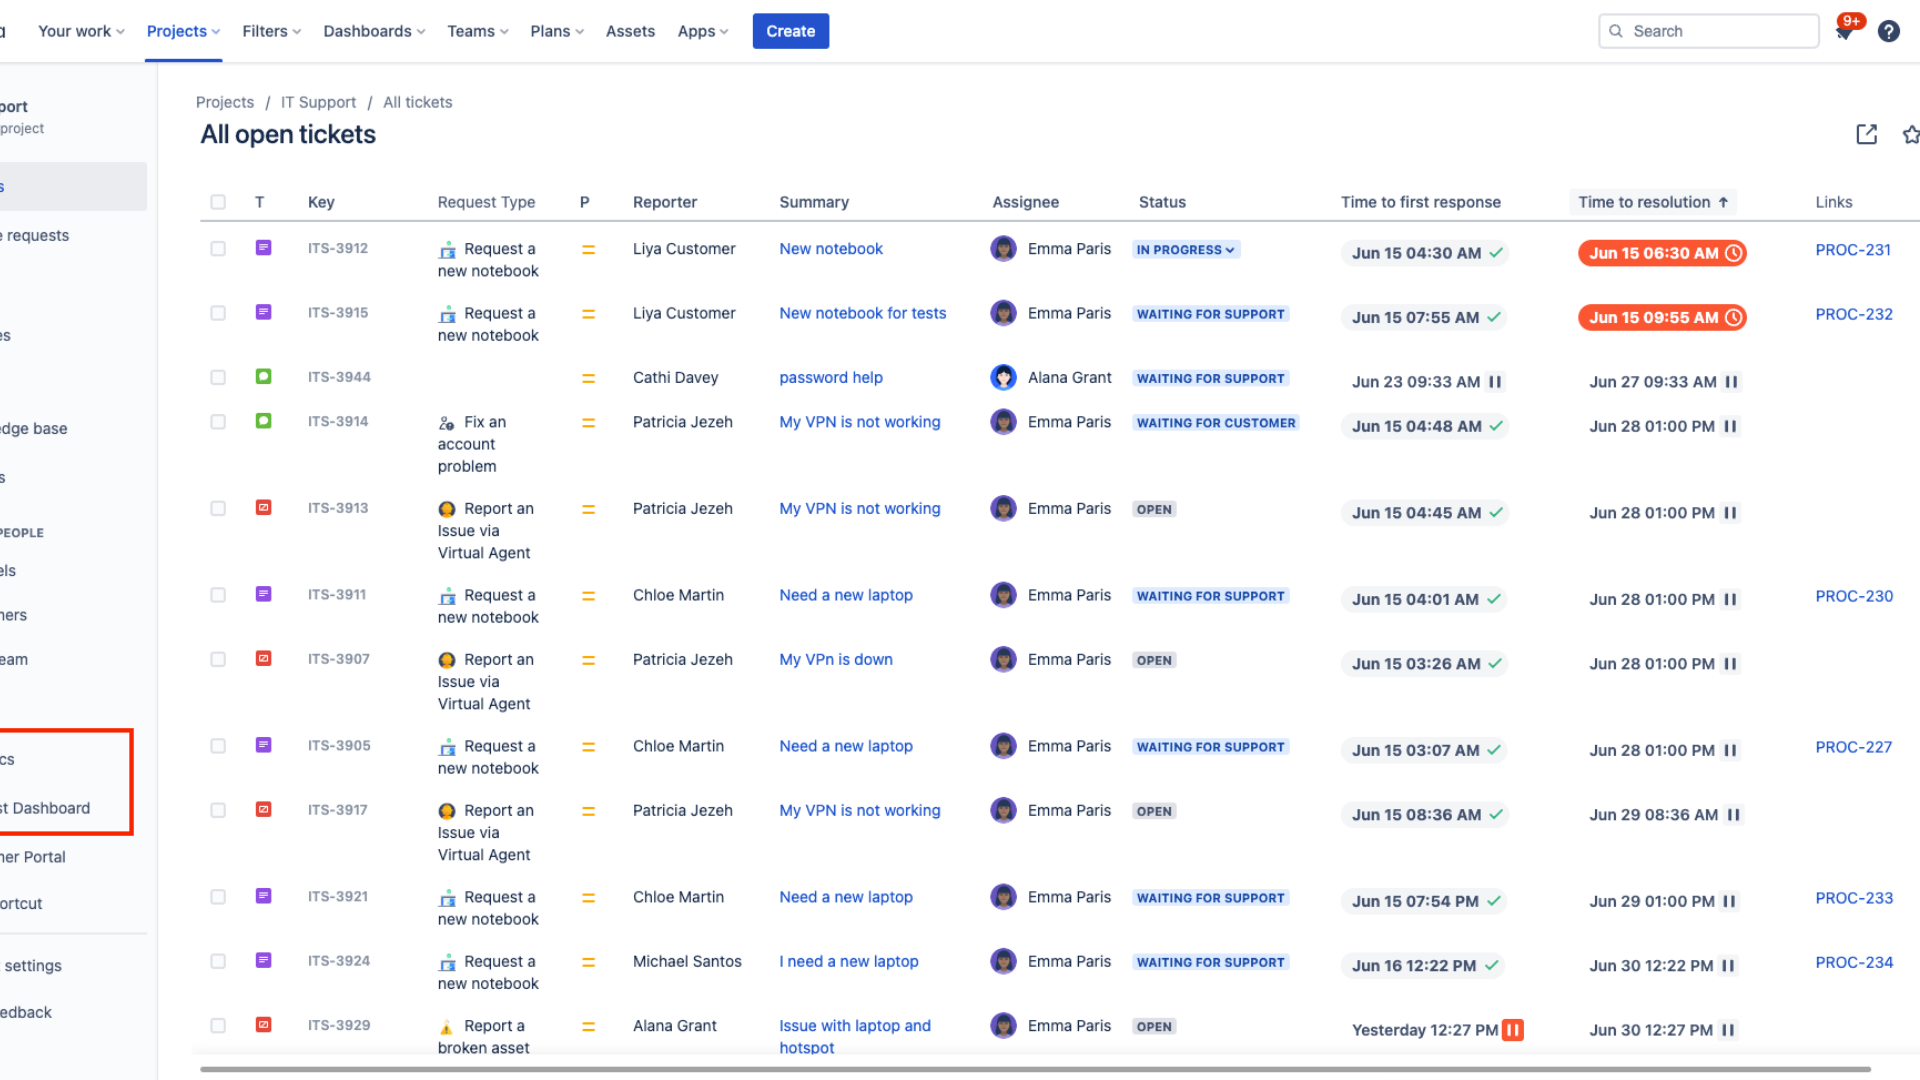
Request Management Insights
-
Focus on CSAT (Customer Satisfaction) and SLA (Service Level Agreement) performance.
-
Identify bottlenecks like delays caused by pending approvals or inefficient processes.
-
Detect automation opportunities to reduce manual work.
-
Set realistic user expectations and align SLA goals by request type.
-
Factor in resolution times for staffing decisions and workload balance.
-
Agents may show as IDs if they're in unmanaged domains. Be aware when reviewing workloads.
Holistic Visibility Across Teams and Projects
With Atlassian Analytics, you’re not confined to a single project or product. You can build dashboards that span multiple products, teams, or even Jira instances. This provides a unified view of operations across the business, while still allowing you to filter for specific departments, projects, or timeframes when needed.
This flexibility makes it easier to collaborate and maintain visibility while tailoring reporting access based on roles or responsibilities.
Incident Management Dashboards
-
Visualize incident inflow and resolution paths to improve MTTR (Mean Time to Resolution).
-
Use categorization reports to detect patterns for proactive issue management.
-
Identify services with recurring SLAs breaches.
-
Refine workflows and update SLAs based on actionable data.
-
Share findings with leadership to drive resource and training decisions.
Share Data with the Right People in the Right Way
Access and visibility are key to democratizing data. Dashboards can be shared via PDF or CSV subscriptions, made available in Confluence using smartlinks, or surfaced directly to customers (with proper permissions).
You don’t need to grant product licenses to every stakeholder. Instead, Atlassian accounts with the “customer” role can receive relevant insights, supporting a more transparent and self-service-oriented culture.
Change Management Reporting for Smarter Decisions
-
Use heatmaps and charts to track change by type, risk, and failure rate.
-
Drill down by team or category to pinpoint areas of improvement.
-
Monitor lead time vs. success rate correlations to refine planning cycles.
-
Track approval delays and determine if steps can be automated or removed.
-
Build dashboards for CAB (Change Advisory Board) meetings to streamline discussions.
Maximize Value from Asset Management Data
-
Leverage asset lifecycle reports to plan for procurement, maintenance, and replacements.
-
Reduce downtime by monitoring asset health and identifying risks early.
-
Improve governance with quarantine alerts and compliance lists.
-
Share team-specific asset reports for better ownership and oversight.
Easy Navigation and Setup for Dashboards
Atlassian makes it simple to get started. You can navigate to Analytics via the main menu or create shortcuts in key projects like IT Operations. The dashboard templates are easy to deploy, and new dashboards can be created or copied from existing ones.
Once dashboards are in place, consider embedding them in Confluence articles using smartlinks. This encourages self-service, cuts down on status emails, and keeps your teams aligned using the most up-to-date data.
Wrapping Up
Better reporting in Jira Service Management isn’t about creating dozens of custom charts; it’s about using the right templates, sharing them effectively, and aligning teams around the same data. Atlassian Analytics makes this possible, helping you move from reactive ticket tracking to proactive service improvement.
Read next.
Change Management in Jira Service Management: A Guide
See how to manage organizational change effectively with Jira Service Management, using proven strategies for lasting adoption across teams
April 16, 2026New Work Types in Jira Business Spaces
Learn how Jira's new work type hierarchy in business spaces gives non-technical teams better structure, and control over their work.
April 16, 2026Web Search in Rovo Agents: What It Is and How to Use It
See how web search in Rovo Agents works, how to set it up, and how teams are using it to bring live web context into their workflows.
April 13, 2026Real-Time Use Cases of Rovo AI in Jira and JSM
See how Atlassian Rovo is changing the way teams work in Jira and JSM in real time.
The blog, weekly.
One email a week with what we published. No drip sequence, and you can leave in a click.